CONTEXT
During my internship at ViewQwest, I worked on one of my major UI/UX design projects: creating an interactive SecureNet dashboard within the Customer Portal System.
For context, SecureNet a cloud-based network protection service with next-generation firewall capabilities. It monitors household internet activity in real time and defends against various cyber threats such as viruses, malware, phishing attempts, and access to malicious websites.
While SecureNet provided strong background protection, users had limited visibility into what was actually happening on their networks. This gap created a valuable opportunity to integrate a dashboard directly into the Customer Portal—giving users a centralized, real-time view of their network activity and security status in one familiar platform.
From Clutter to Clarity: Why Change Was Needed
THE PROBLEM


Previously, dashboard data was shown as static, disconnected graphs outside the Customer Portal. This approach led to several usability issues: the numerous isolated charts made it difficult to see the bigger picture, and the cluttered layout would overwhelm non-technical users. Insights were scattered and non-actionable, requiring manual interpretation without context.
The Design Approach
OBJECTIVES
Go Beyond Common Charts: Must incorporate other dashboard components aside from common bar charts (rectangular) and pie charts to present data in clearer and more user-friendly formats
Simplify Without Losing Depth: Reduce visual clutter and group related information to help users easily understand their network activity and security status at a glance.
Make Dashboard Interactive: Enable users to filter and explore highlighted threats or app usage activity through dynamic, real-time interactions.
Improving the Dashboard Experience
FINAL DESIGN
Interactive Filtering: Users can filter by date and time range to refresh the dashboard, with charts updating in real time to reflect the latest data. The toggle in refresh button is used to enable or disable automatic dashboard refresh.
Security Profile: This section displays the type of network security the user is currently using, such as Standard and Enhanced with ChildSafe or AdBlock. It also shows the total hits, which represent the number of times SecureNet has detected or blocked potential threats under each security profile.
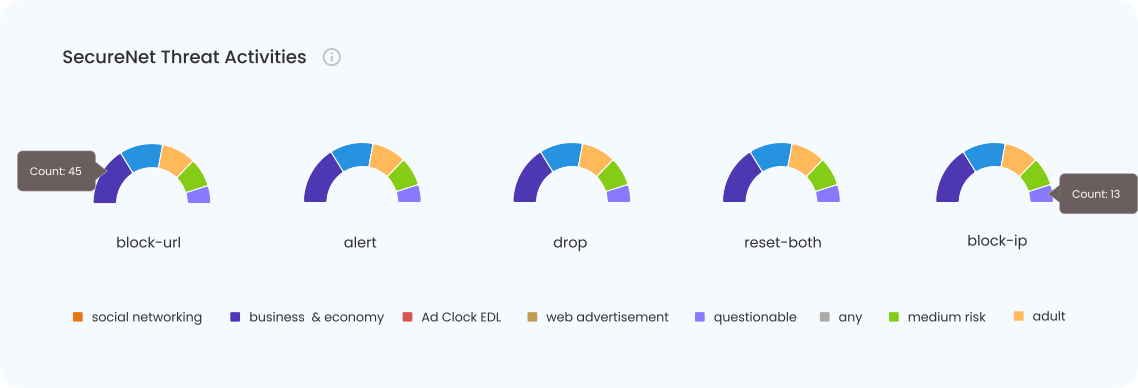
SecureNet Response: This section visualizes the different types of threats detected by SecureNet and the corresponding actions taken to mitigate them. Each semi-donut chart represents a specific type of threat response, while each color within the chart indicates a particular threat category or context.
Threats Map: This is an interactive geographic visualization that displays security threats by country. It highlights attack origins and destinations, showing real-time threat flows using connecting lines. The top 5 Destination Countries list summarizes where most threats are directed, with counts and type breakdowns for better threat analysis.
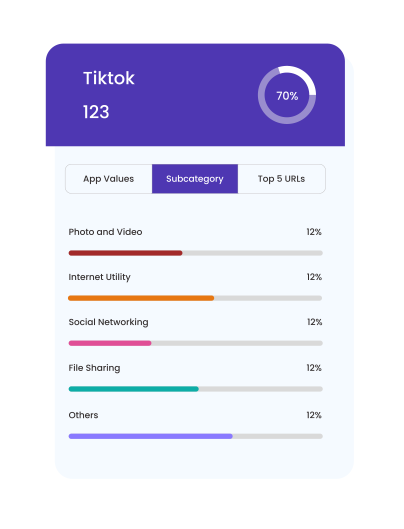
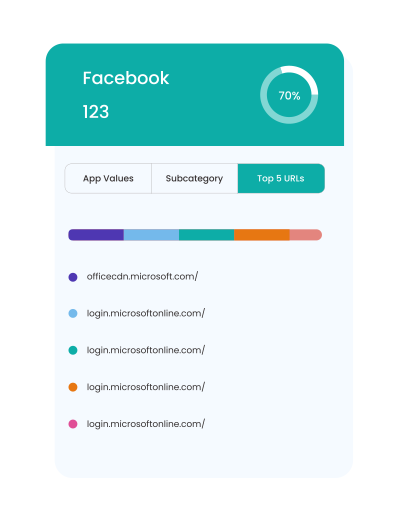
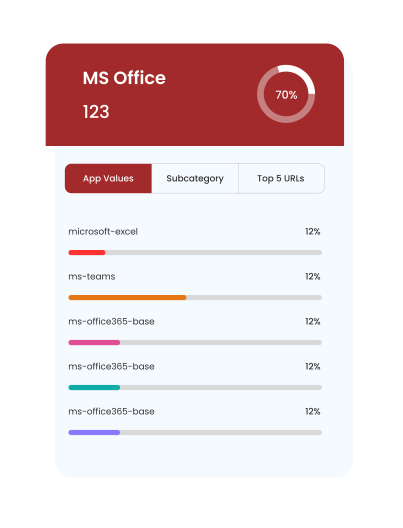
App Usage: This interface provides a detailed breakdown of application usage by showing total activity, percentage share, and usage trends. Users can view app components, functional categories, and top accessed URLs through interactive tabs. It helps monitor app behavior for usage insights and potential security analysis.

What I Learned Along the Way
PROJECT TAKEAWAYS
KEY CHALLENGE
How might we transform this static, complex data into an interactive dashboard experience so that users can easily understand their network security status and take informed actions based on real-time insights?


SecureNet
Dashboard
Type Internship Project, Web Design
Role UI/UX Designer
Date February - March 2025
Tools
Collaborate and Communicate: The project was overwhelming due to its complexity, but constant communication with developers and stakeholders helped clarify the requirements. I learned to welcome constructive feedback and confidently explain my design decisions.
The Value of User Research: In hindsight, I recognized the importance of conducting deeper user research early in the process. Time constraints limited this and this taught me how essential user insights are and it’s something I will prioritize more in future projects.
Simplifying Cybersecurity with SecureNet Dashboard